[Updated] Alli Cognitive Search User Guide - Analytics
You can access the Analytics menu from the left navigation bar and check a variety of analytics regarding the usage of Alli Cognitive Search.
![[Updated] Alli Cognitive Search User Guide - Analytics](https://storage.ghost.io/c/25/08/2508d674-c9ef-4185-bac1-aa40fd9cdbdd/content/images/size/w2000/2022/04/ANALYTIC-2.jpg)
Update on 10/19/2021 - You can now sort most tables by most columns. You can also change the sorting order (ascending/descending).
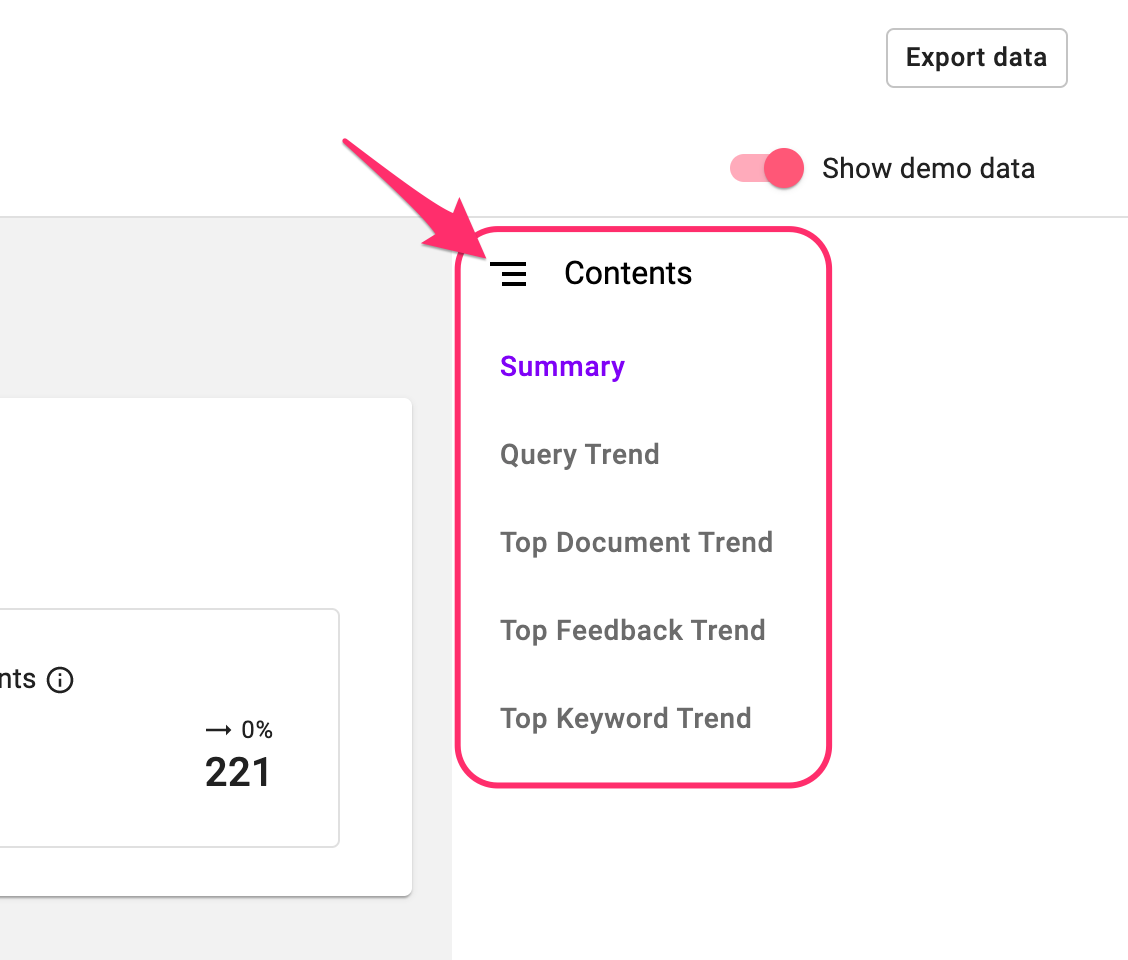
Update on 8/24/2021 - Contents list is added on the right side of the screen. You can click any items for faster navigation.
Updated on 8/2/2021 - Top Documents trend chart, Top Feedback trend chart, Top Keyword trend chart are added.
You can access the Analytics menu from the left navigation bar and check a variety of analytics regarding the usage of Alli Cognitive Search.
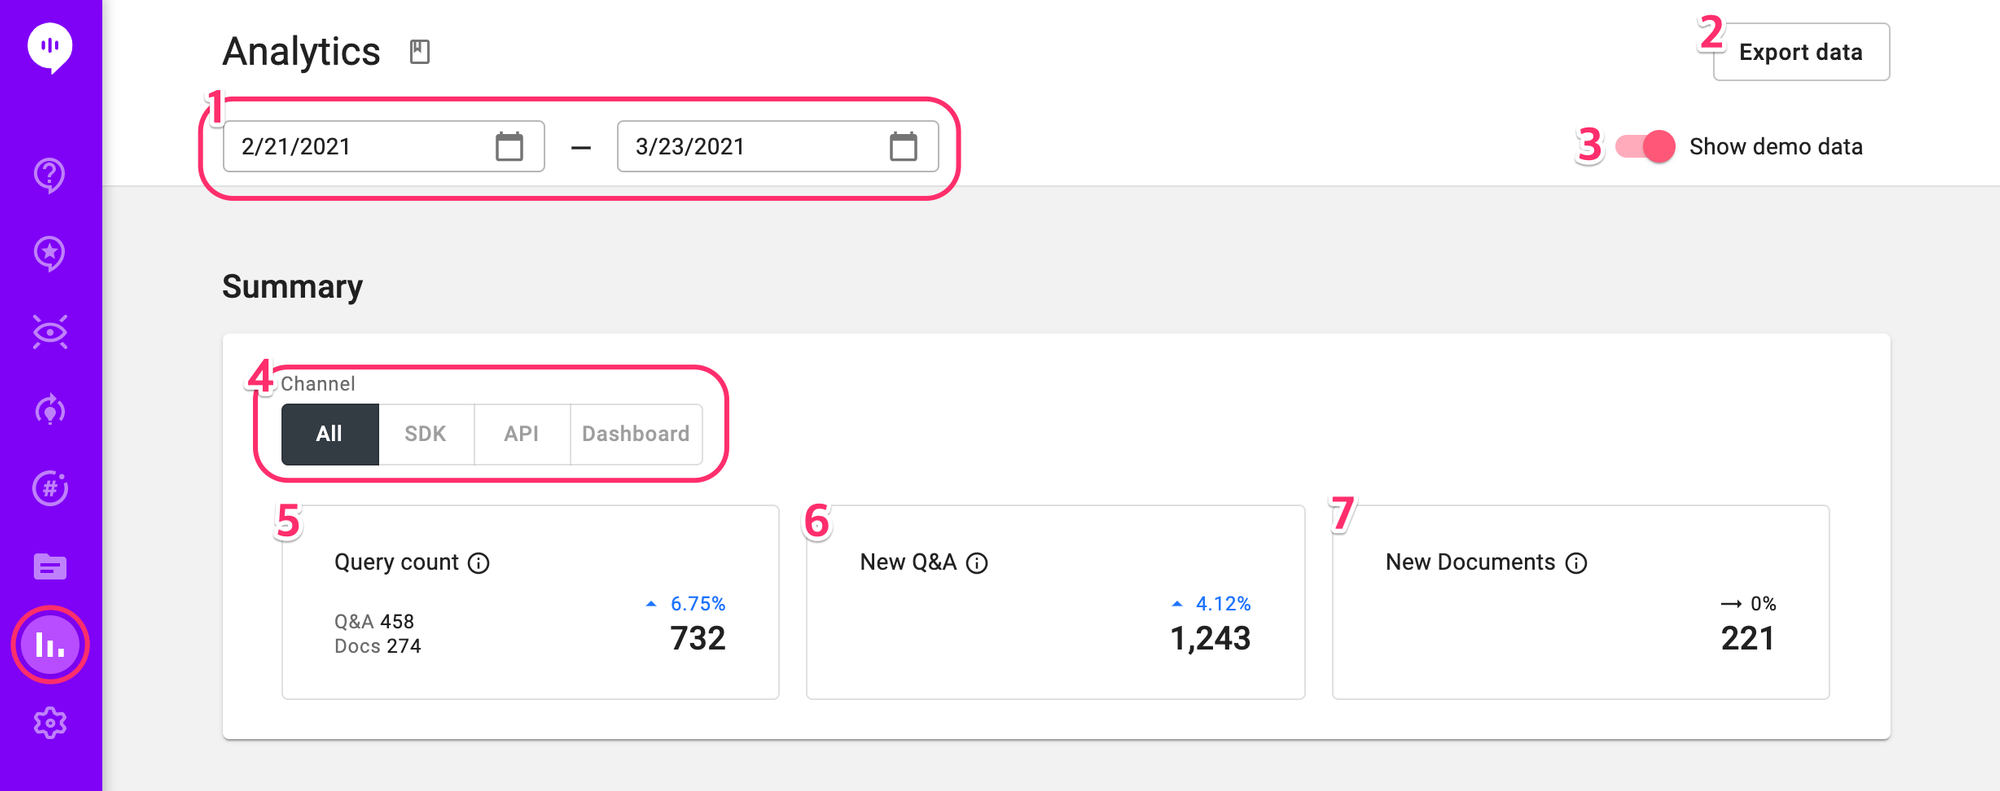
- Date Range: You can select the date range you want to look over the analytics within here.
- Export data: Download the analytics data you are seeing.
- Show demo data: Show arbitrary data to check how Analytics data looks like.
Summary section
You can see the overall usage of Alli cognitive search under the Summary section, filtered by channels.
4. Channel filter: Click each channel to see the break-down numbers from each channel (SDK, API, and Dashboard).
5. Query count: Total number of questions toward Q&A or Documents from users.
6. New Q&A: Total number of new Q&As added during the date range.
7. New Documents: Total number of new Documents uploaded during the date range.
Query Trend Graph
The Query Trend graph shows the daily trend of the number of queries using Q&A or Documents. You can apply Channel and/or Source filter.
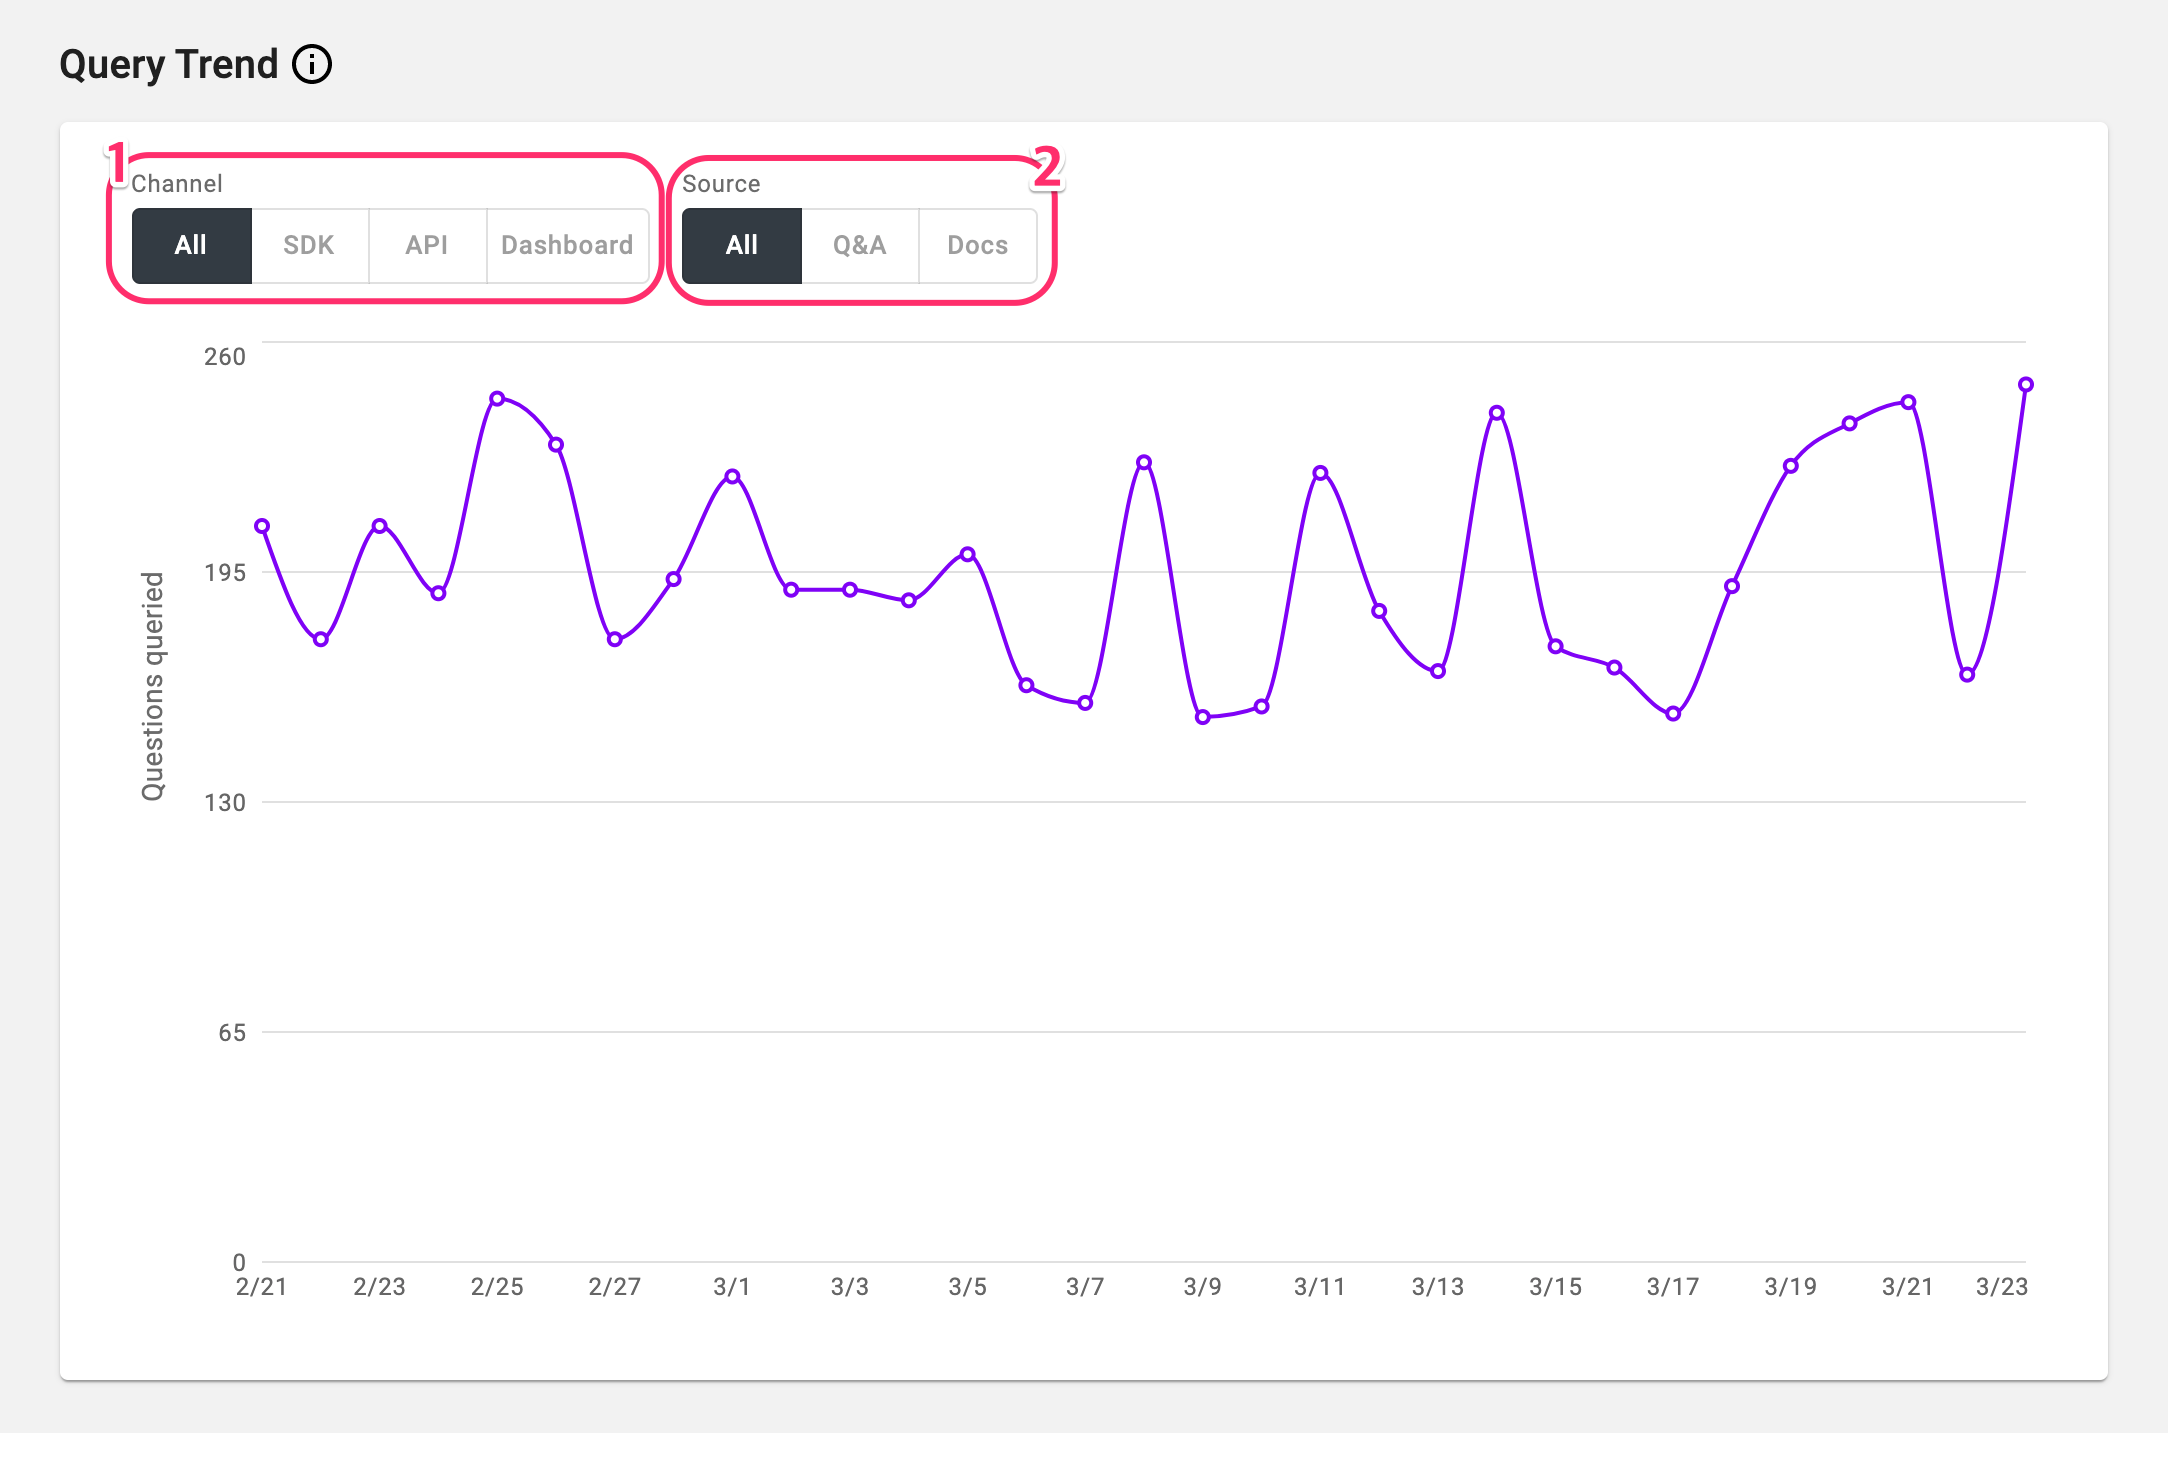
- Channel filter: Click each channel to see the break-down numbers from each channel (SDK, API, and Dashboard).
- Source filter: Click each source to see the break-down numbers from each knowledge source (Q&A, Documents)
Top Document Trend
Top Documents searches made in selected date range. You can see the top 5/10/20 most suggested Documents search query & result pairs and the number of suggested.

Top Feedback Trend
You can see the search query and result pairs that have the most number of feedbacks in selected date range, over the project's entire knowledge base including Q&As and Documents. The result can be filtered by channel, source, and the type of the feedback (positive or negative).

Top Keyword Trend
You can see most popular keywords that are included in any search queries to the project's knowledge base in selected date range. Alli extracts the keyword automatically from search queries to create this chart.

Learn More About Allganize's Technology