[Updated] Alli User Guide - Analytics
Check out all the new features in Analytics. #menu #manual

![[Updated] Alli User Guide - Analytics](https://storage.ghost.io/c/25/08/2508d674-c9ef-4185-bac1-aa40fd9cdbdd/content/images/size/w2000/2022/04/analytic.jpg)
The Analytics dashboard allows you to quickly highlight key statistics and trends related to Alli usage data. You can quickly identify useful information like what questions are asked from internal/external customers & how much of them are being responded by AI.
Table of Contents
Menu
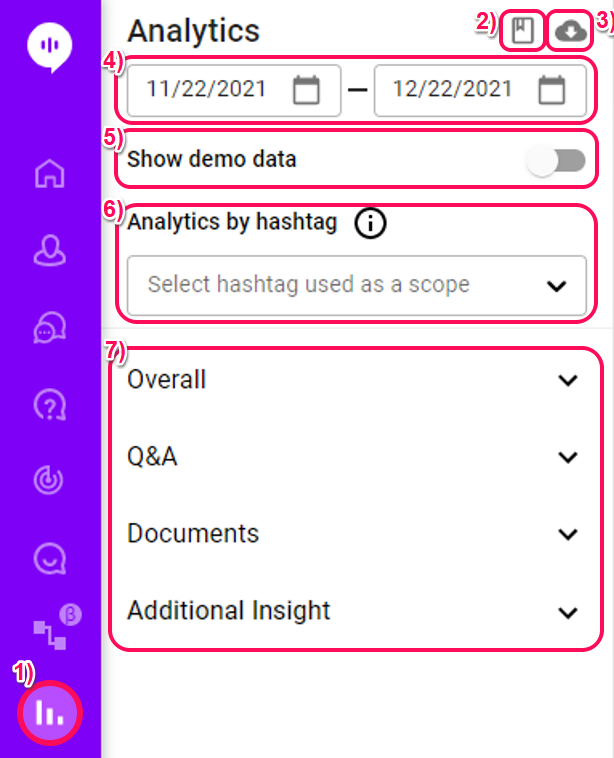
1) Select the analytics icon from the main navigation menu.
2) Link to analytics user guide (here).
3) Export data: Select up to 6 months of analytics data to export as an excel spreadsheet.
List of Downloaded Information
Summary Conversations Chat Node Selections Query Trend Q&A Trend Top Q&A Trend (ALL) Top Q&A Trend (SDK) Top Q&A Trend (Third) Q&A Trend by hashtag (ALL) Q&A Trend by hashtag (SDK) Q&A Trend by hashtag (Third) Q&A Candidates Trend Top Q&A Candidates Trend ALL Top Q&A Candidates Trend SDK Top Q&A Candidates Trend Third Similar Q candidates Trend Top Similar Q Trend ALL Top Similar Q Trend SDK Top Similar Q Trend Third Top Document Trend ALL Top Document Trend SDK Top Document Trend DASHBOARD Top Document Trend Third Doc Trend by hashtag ALL Doc Trend by hashtag SDK Doc Trend by hashtag DASHBOARD Doc Trend by hashtag Third Top Feedback Trend ALL(P) Top Feedback Trend ALL(N) Top Feedback Trend SDK(P) Top Feedback Trend SDK(N) Top Feedback Trend DASHBOARD(P) Top Feedback Trend DASHBOARD(N) Top Keyword Trend ALL Top Keyword Trend SDK Top Keyword Trend DASHBOARD Top Keyword Trend Third AI Response Trend Suggestion Accuracy Trend Suggestion Accuracy Trend Rate KnowledgeBase by hashtag4) Select date range: Show up to 1 month of information in analytics dashboard.
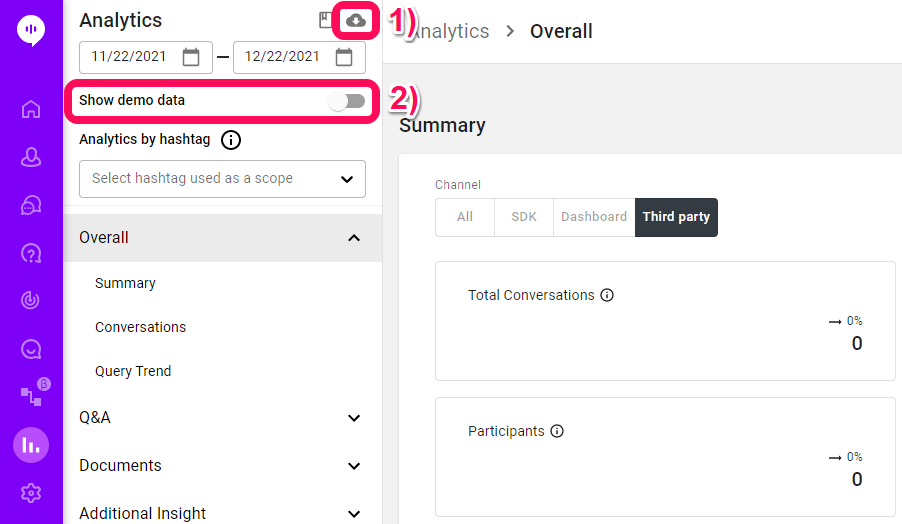
5) Show demo data: Toggle this button on to see the full potential of each statistic and graph with sample data.
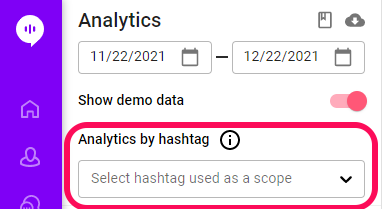
6) Analytics by hashtag: Filter all statistics and data to show information related to a specific hashtag.
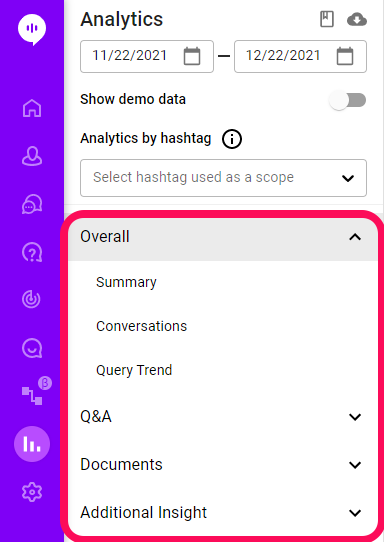
7) Analytics list: All analytics are grouped into 4 categories to make it easier to navigate to the data you are looking for.
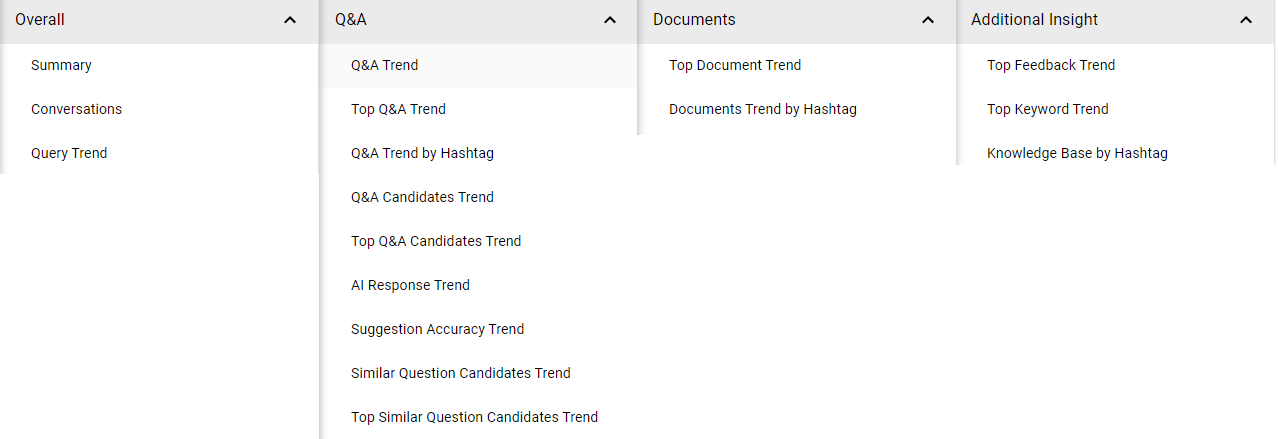
Overall Analytics
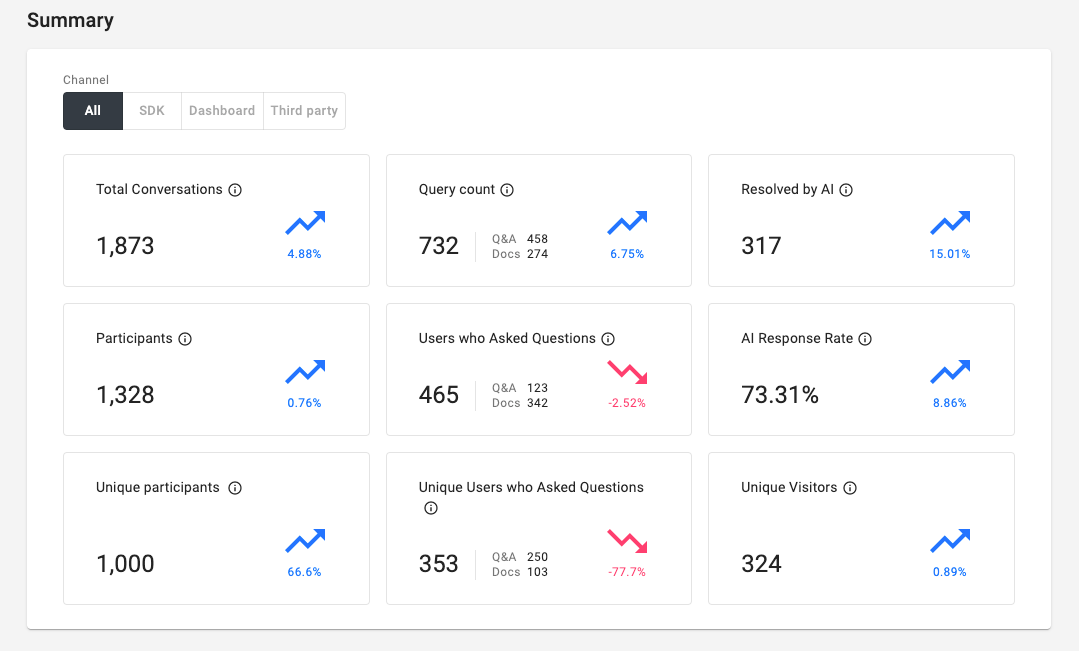
Summary: You can see overall usage of Alli and how efficiently the AI is responding to questions briefly in the Summary section. You can select a channel to only see analytics from the selected channel.
- Total Conversation: Number of conversations made within the date range.
- Participants: Sum of daily unique counts of users who had conversations with Alli.
- Unique participants: Unique count of users who had conversations with Alli within the date range.
- Query Count: Total number of questions toward Q&A or Documents from users. It includes questions asked from the Answer with Q&A node, Answer with Documents node, and the Alli dashboard.
- Users who Asked Questions: Sum of daily unique counts of users who asked questions at least once toward Q&A or Documents.
- Unique Users who Asked Questions: Unique count of users who asked questions at least once toward Q&A or Documents.
- Resolved by AI: The number of answers customers selected upon their questions from the Answer with Q&A node.
- AI Response Rate: The ratio of 'Resolved by AI' over the number of questions asked from the Answer with Q&A node.
- Unique Visitors: Unique count of visitors to the webpage where Alli SDK is integrated. This number is the 'Number of Users' for billing calculation.
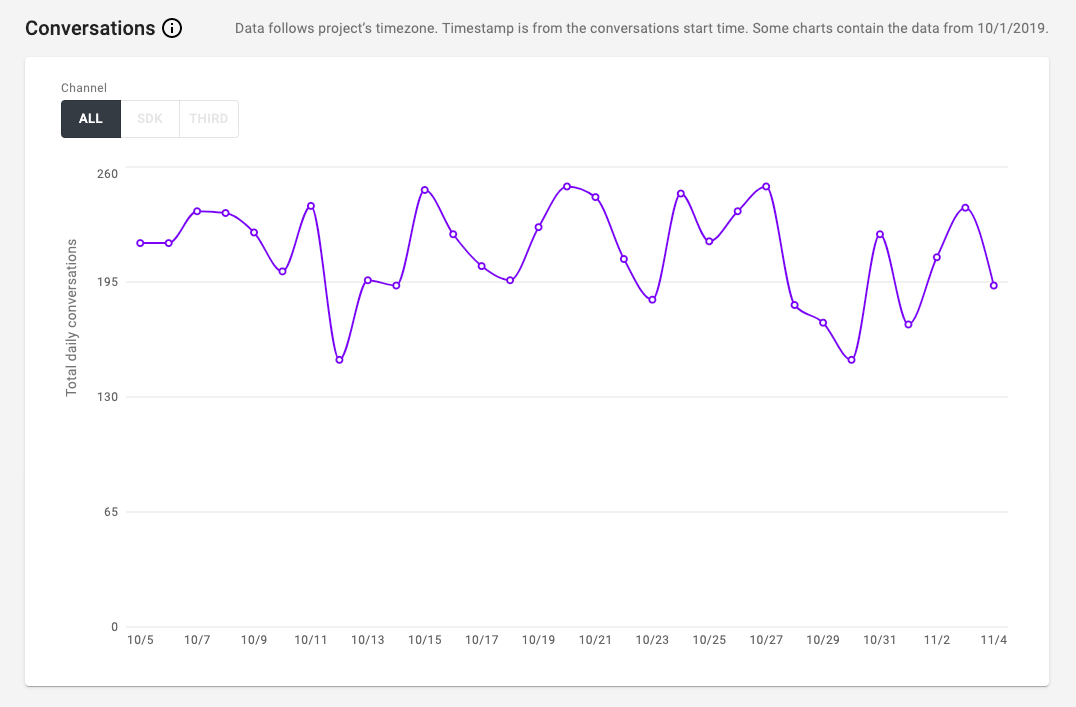
Conversations: Daily trend of conversations happened in selected date range. One of the ways to see the usage trend of Alli.
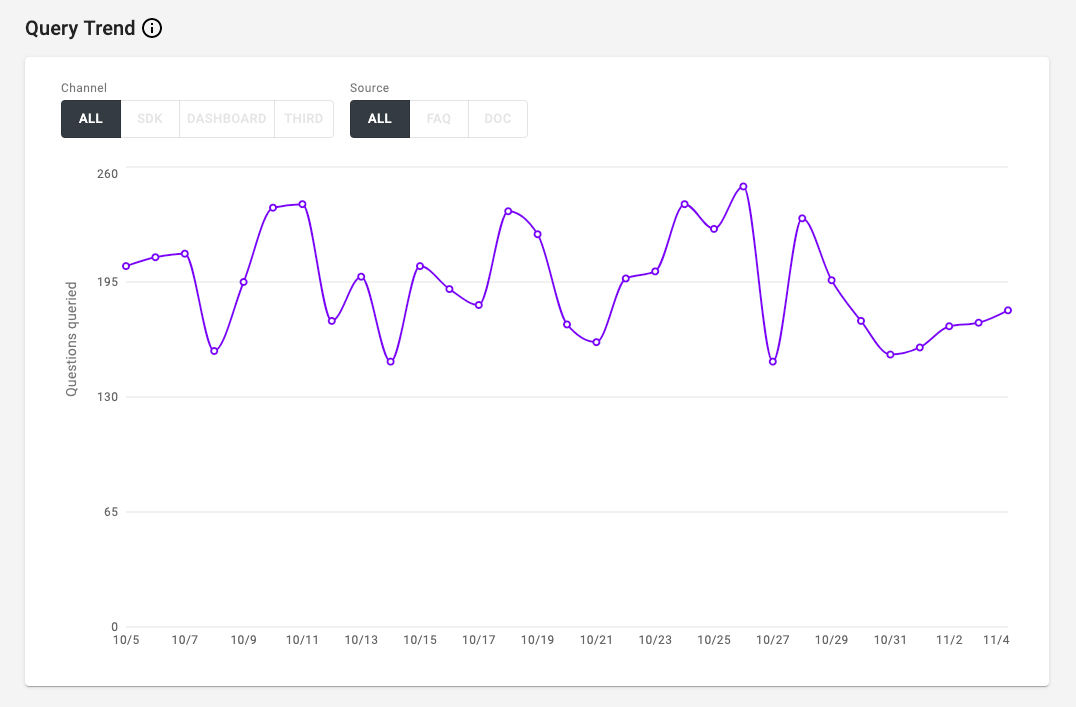
Query Trend: Daily trend of any search queries using Q&A or Documents, including questions from the Q&A and Documents node and from the dashboard.
Q&A Analytics
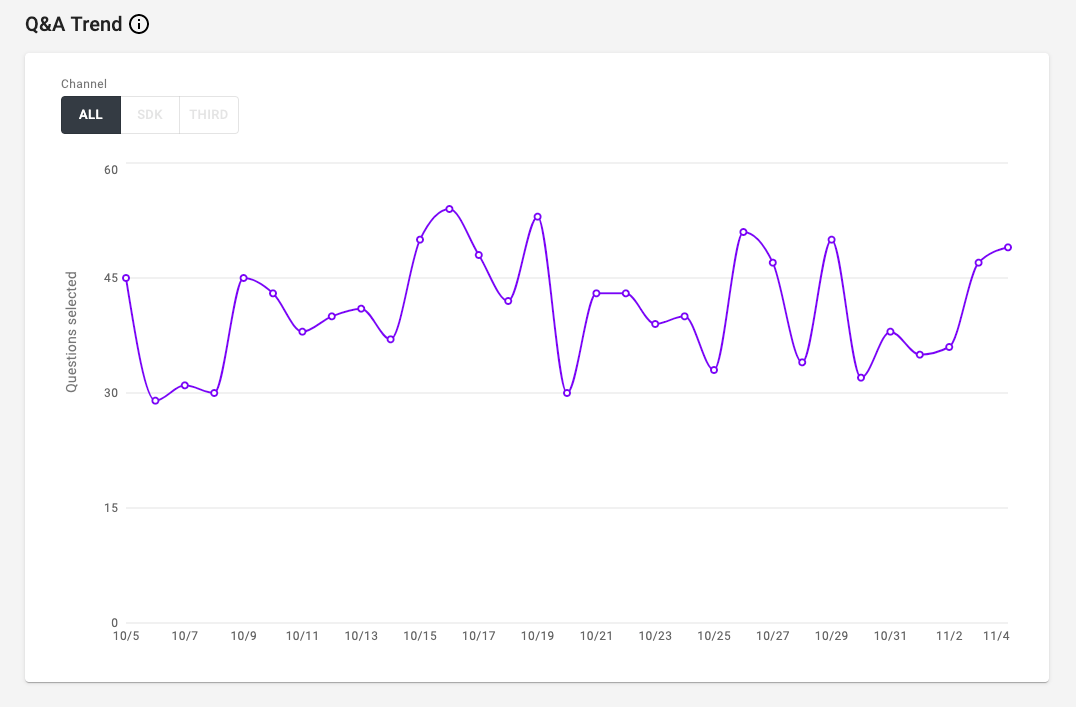
Q&A Trend: Daily trend of Q&A from Q&A node in selected date range. Another way to see the usage trend of Alli.
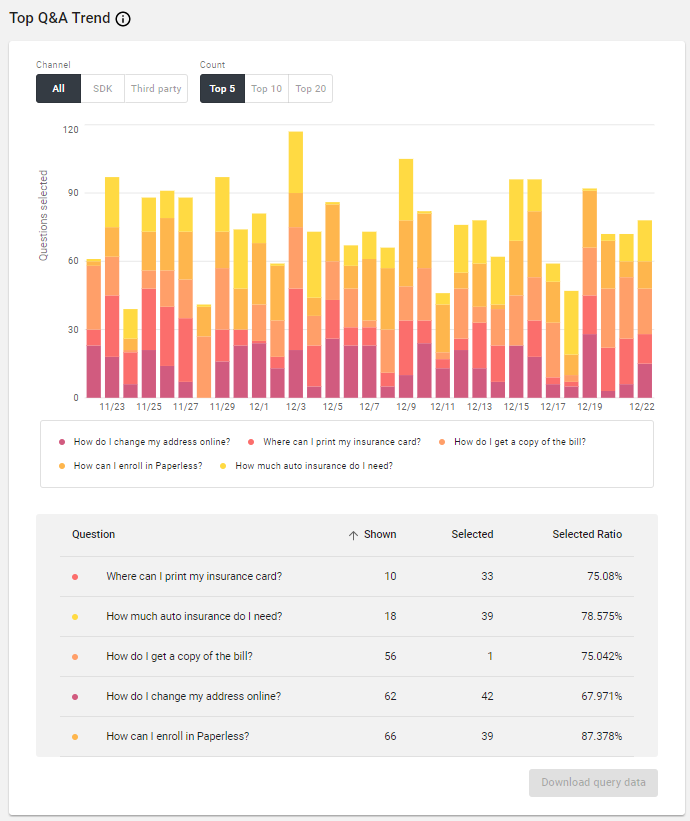
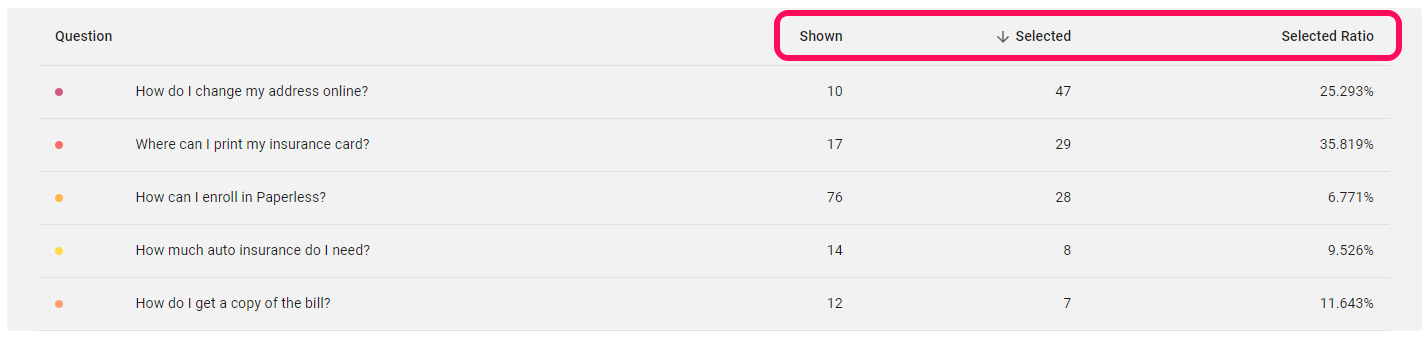
Top Q&A Trend: Top Q&As with the highest number of selected questions in selected date range. You can check what questions are asked most and choose to do some follow-ups, such as adding proper chat flow after the top question, or let related departments know that these questions are being asked a lot. The count filter allows you to narrow down the amount of information to display on the graph. The same Q&A are shown in the table below the graph which can be sorted by shown, selected, and selected ratio.
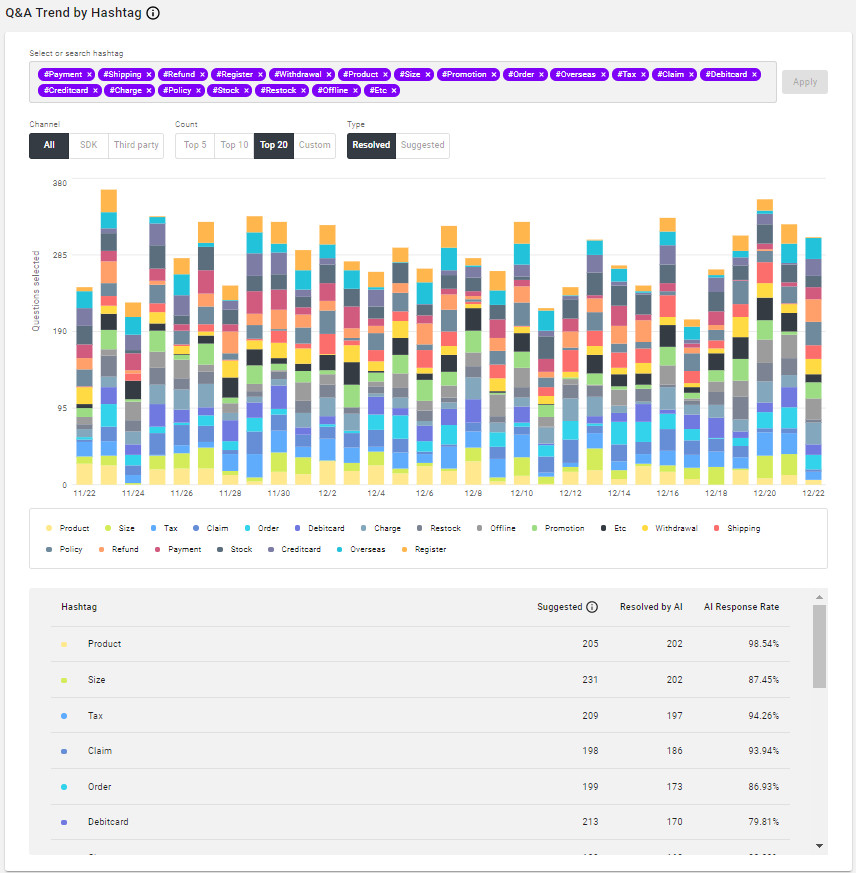
Q&A Trend by Hashtag: Daily trend of Q&A broken down by hashtag. Display data for up to 20 of the top the top hashtags. Filter by channel or by if the hashtag is resolved or suggested. See the same hashtags are shown in the table below the graph with information on suggested, resolved by AI, or AI response rate.
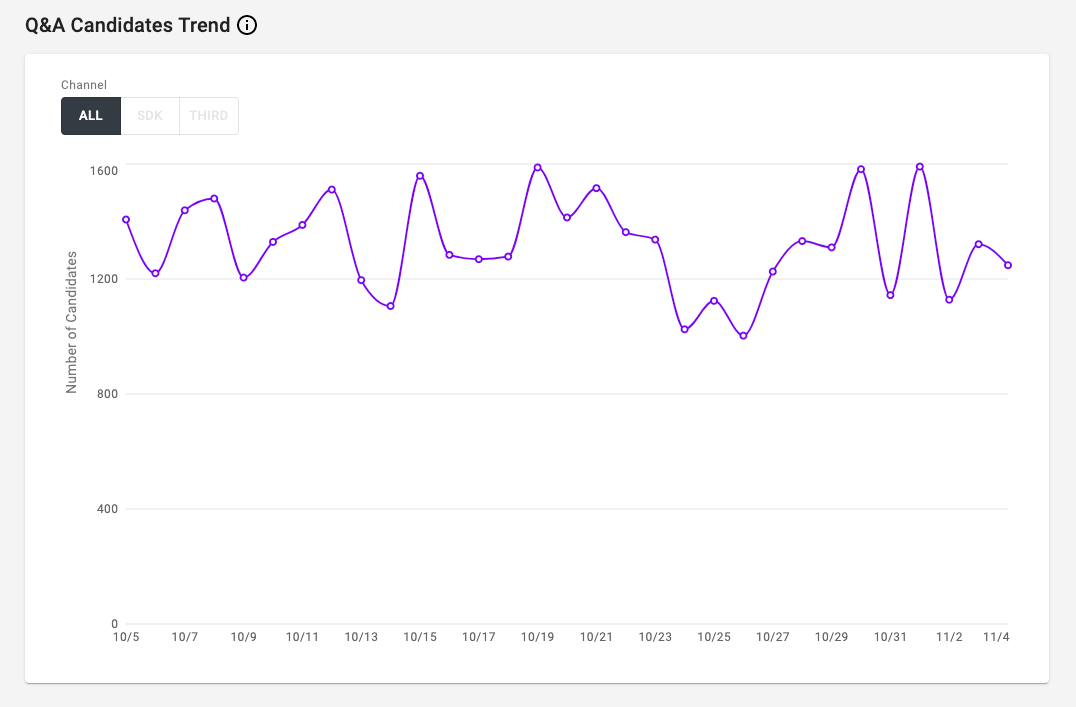
Q&A Candidates Trend: Daily trend of the number of Q&A candidates registered. If the number or the trend is too high, you should consider adding the candidates to the Q&A database. It may mean that some issues are rising and your Q&A database is not ready to answer the questions regarding the issues.
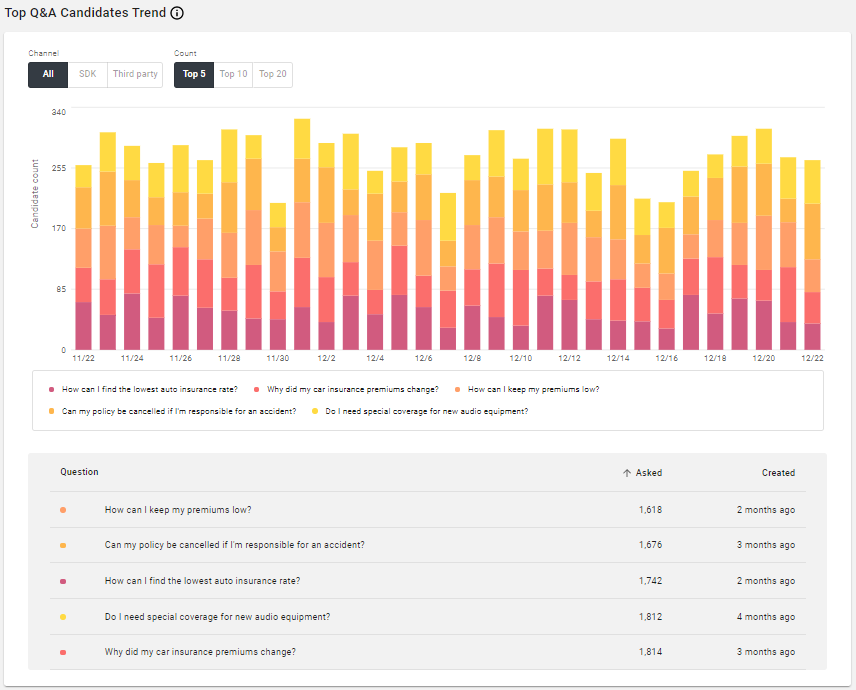
Top Q&A Candidates Trend: Top Q&A candidates registered in selected date range. You can see what questions are unanswered and remains as Candidates. If there're similar questions asked, they'll be shown as grouped here. You can choose how many top Candidates you want to see to narrow down the data displayed. The same candidates are shown in the table below the graph and can be sorted by number of times asked and the date the candidate was created.
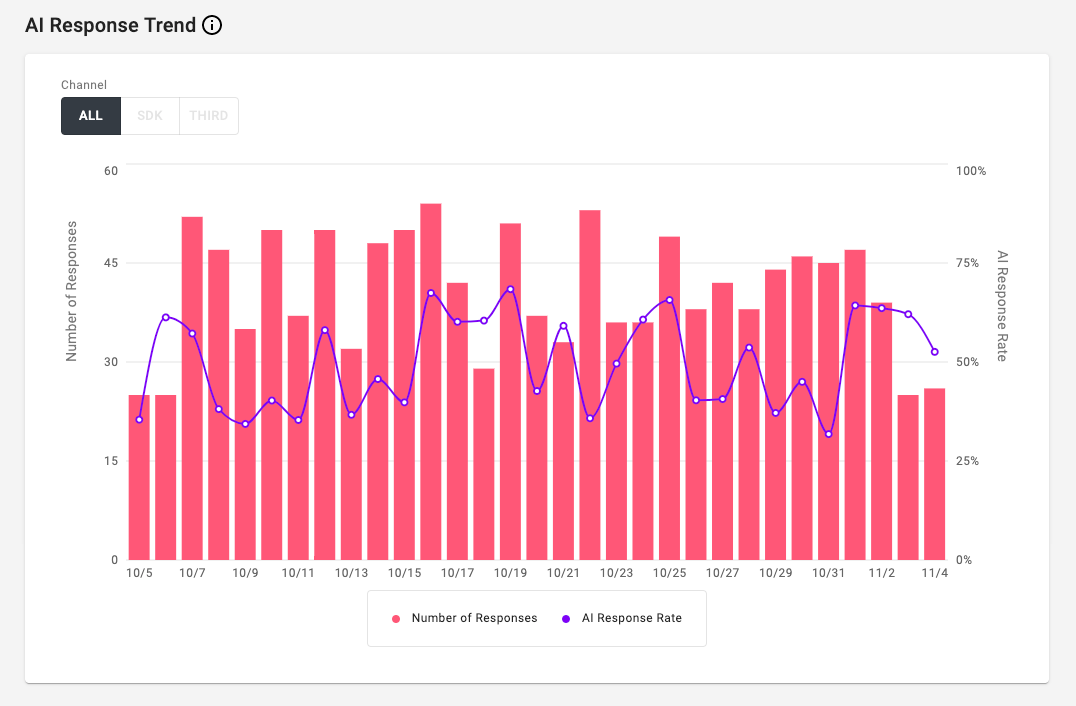
AI Response Trend: Daily trend of the number of responses by AI & AI Response rate in selected date range. This is critical information to keep your Q&A database up to date & resourceful. Please monitor this graph regularly.
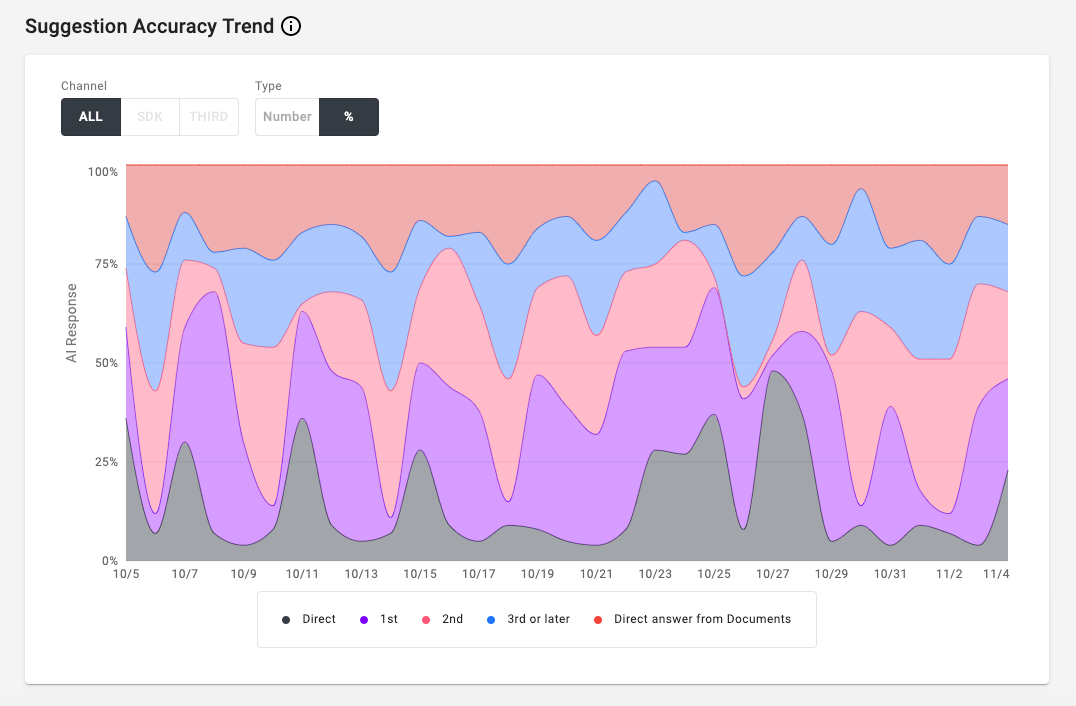
Suggestion Accuracy Trend: Daily trend of suggestion accuracy by AI in number or percentage. This graph shows you how accurate your AI is, so you can adjust Q&A configuration or add more Q&A data to your database. Always keep the portion of 'Direct' and '1st' higher so your AI remains reliable to internal/external customers.
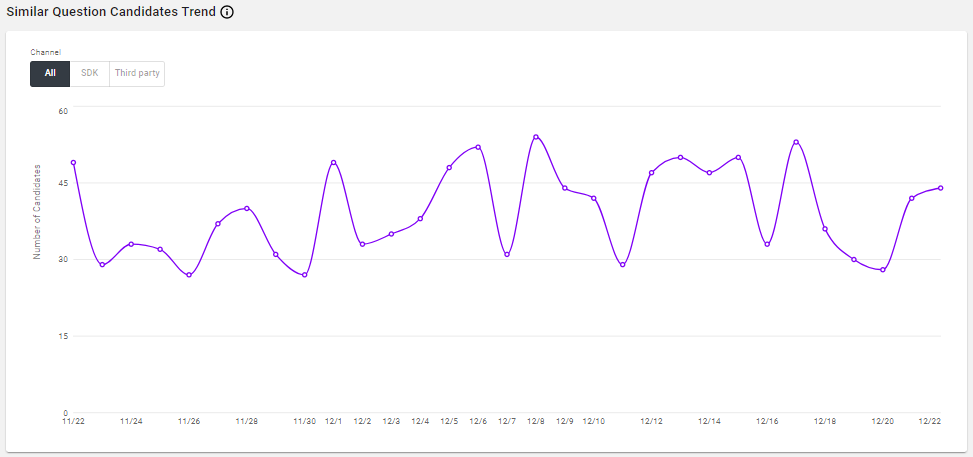
Similar Question Candidates Trend: Daily trend of similar question candidates suggested based on user query.
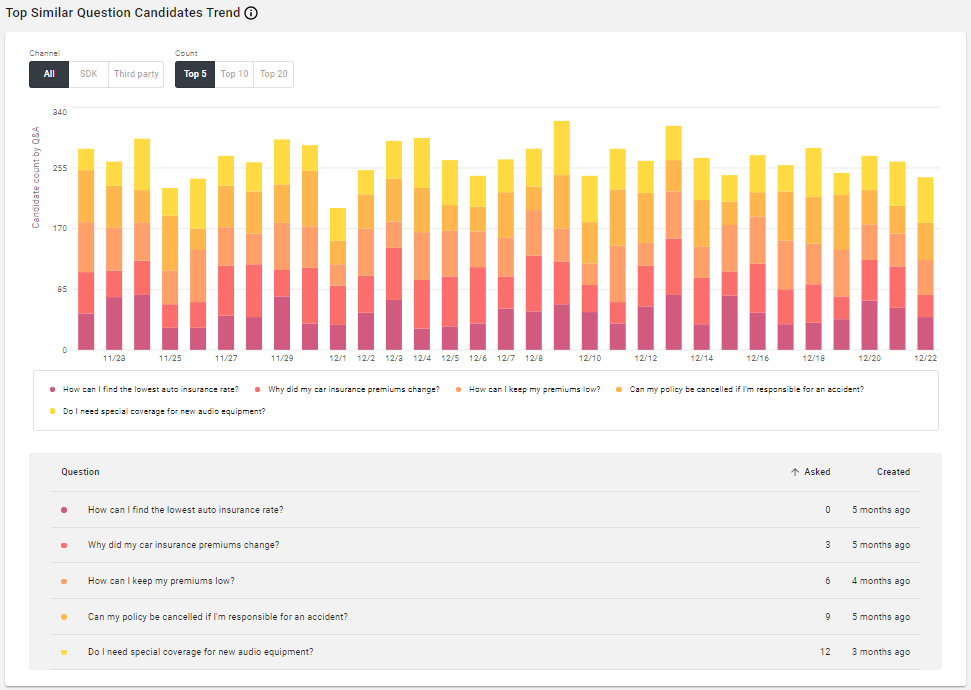
Top Similar Question Candidate Trend: Top questions that are being queried with similar questions by users. Add or remove these similar question candidates to Knowledge Base to keep improving the AI's answering accuracy. The same candidates are shown in the table below the graph and can be sorted by number of times asked and the date the candidate was created.
Documents Analytics
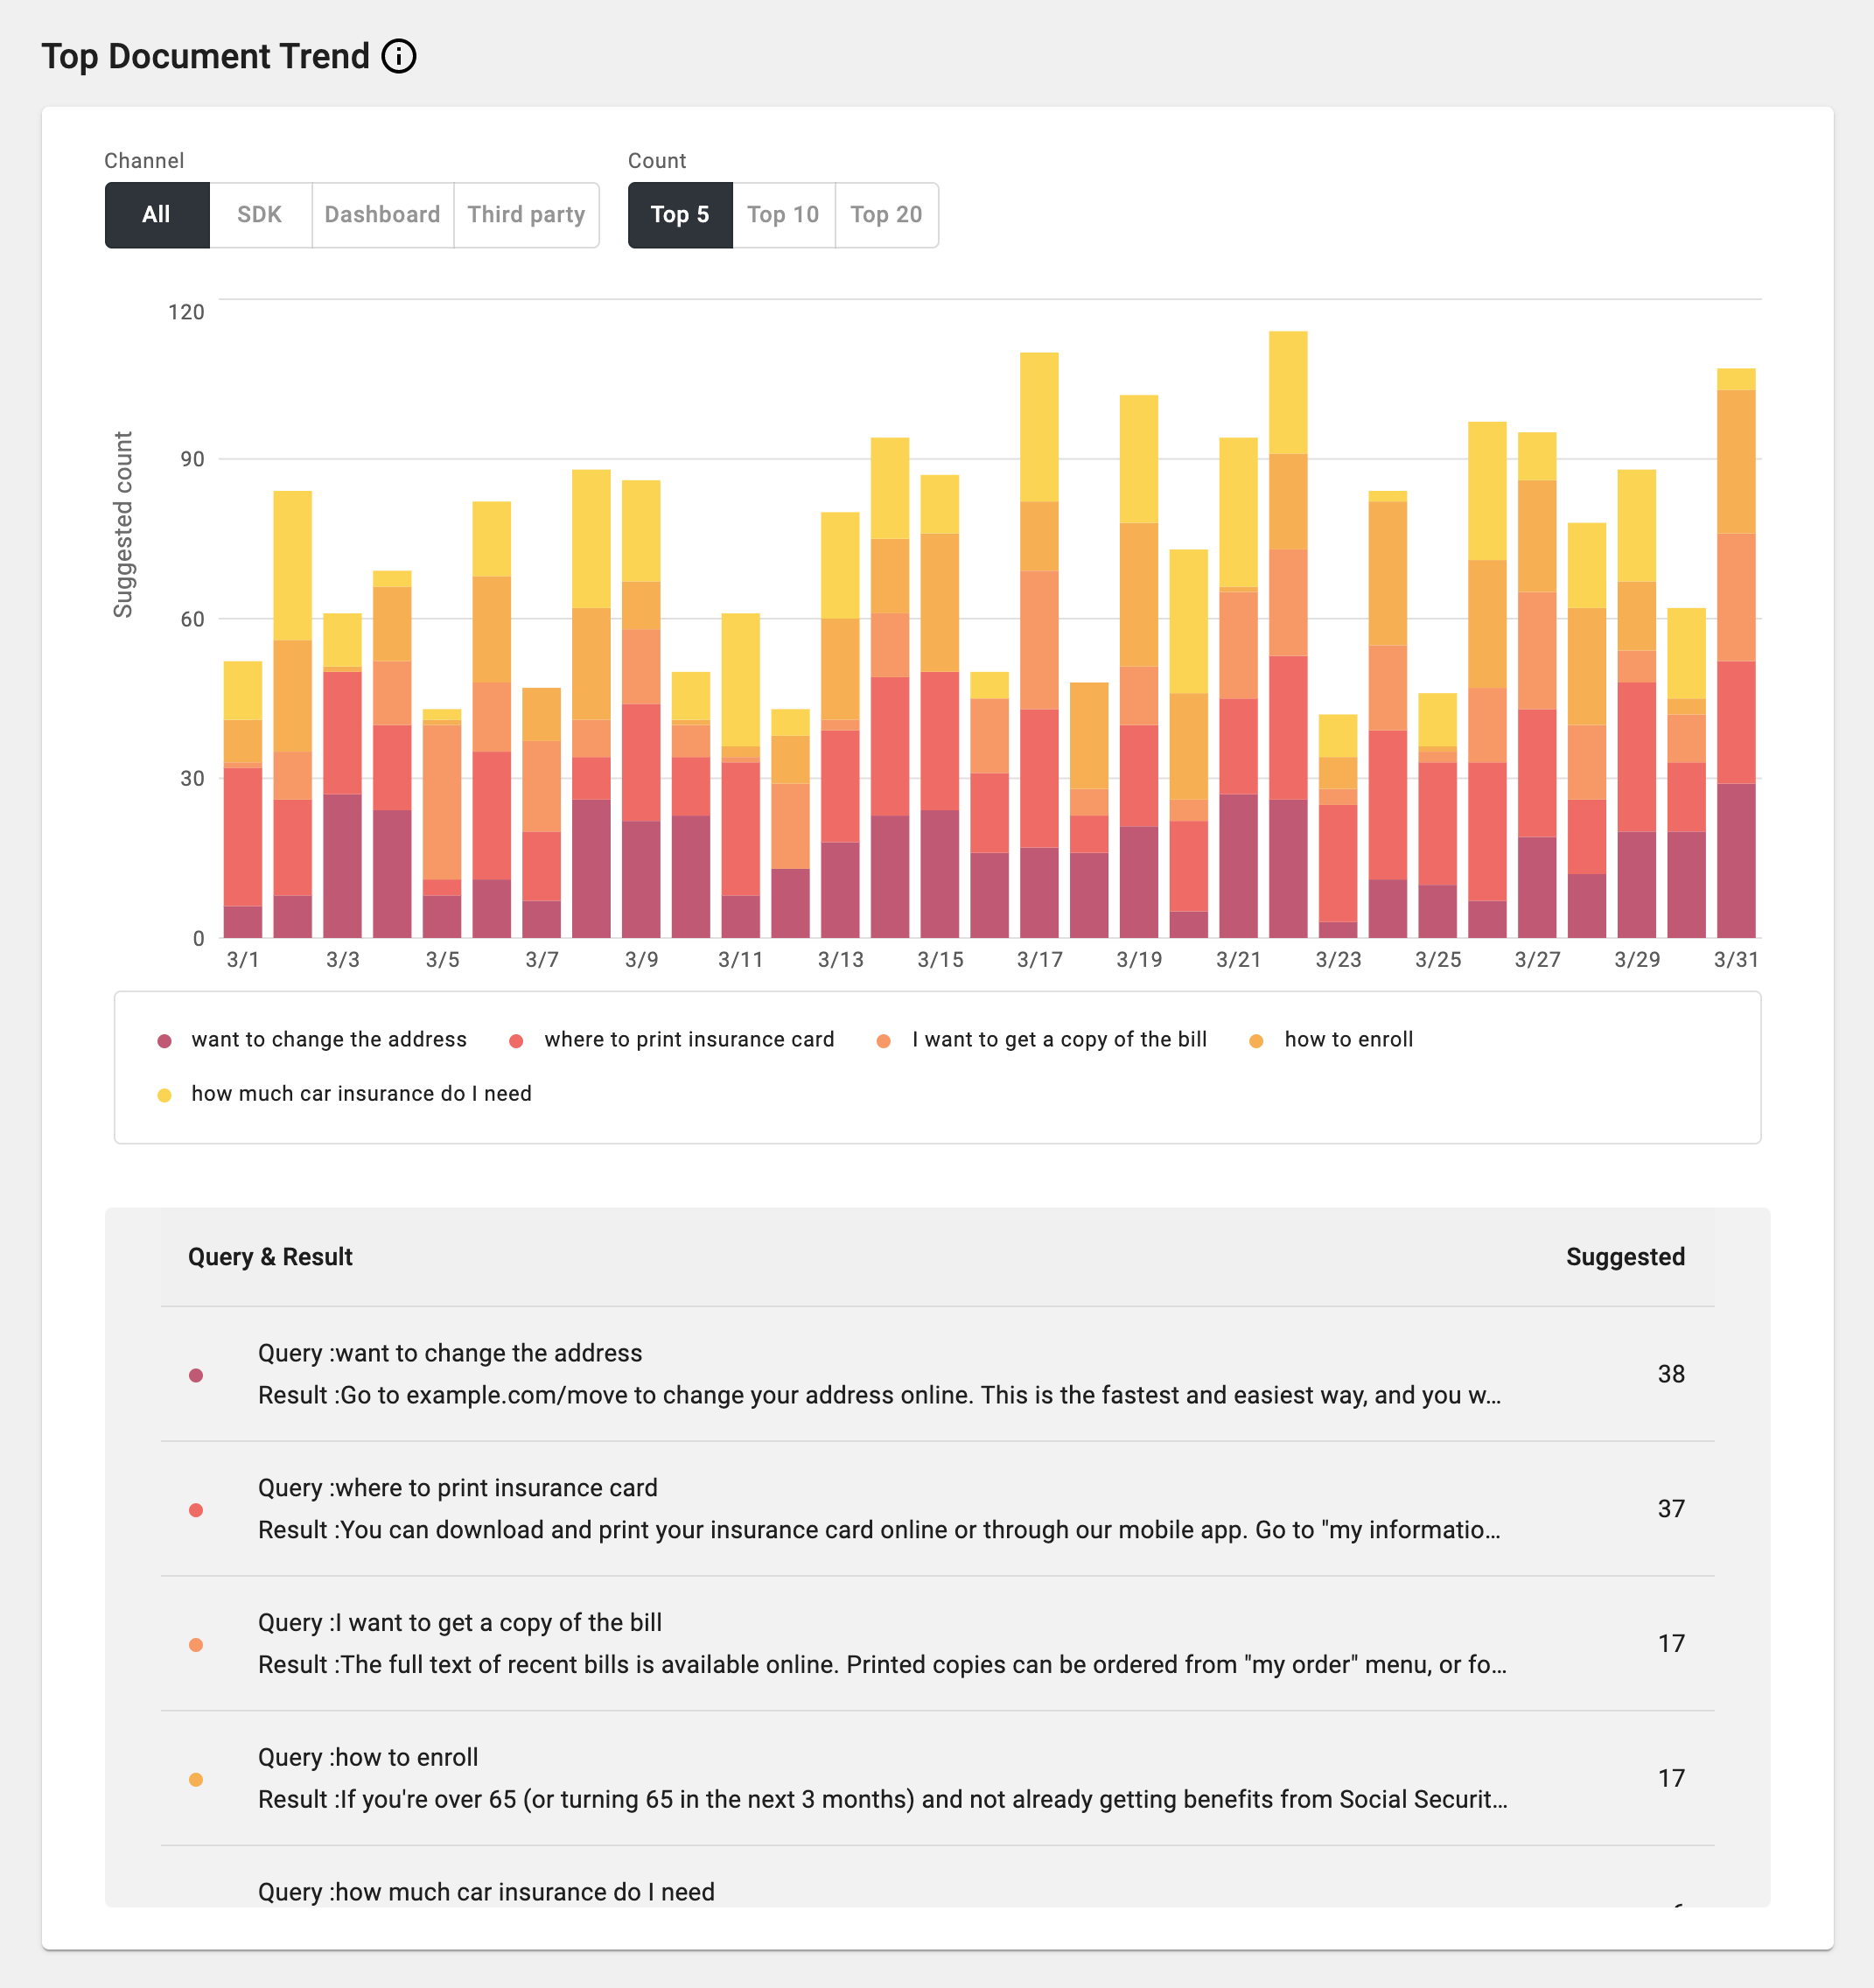
Top Document Trend: Top Documents searches made in selected date range. You can see the top suggested Documents search query & result pairs and the number of suggested. The same searches are shown in the table below the graph and can be sorted by number of times it was suggested.
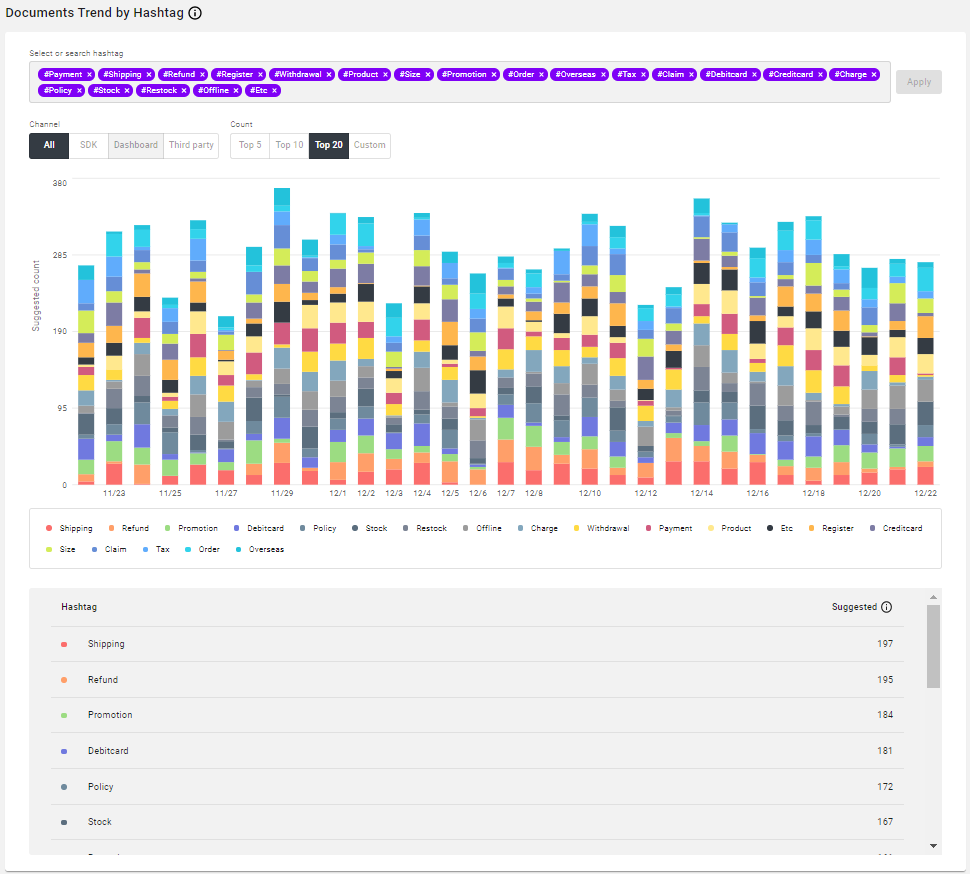
Documents Trend by Hashtag: Daily trend of documents searches broken down by hashtag. Display data for up to 20 of the top the top hashtags. Filter to a specific channel if desired. See the same hashtags in the table below the graph with information on suggested, resolved by AI, or AI response rate.
Additional Insight
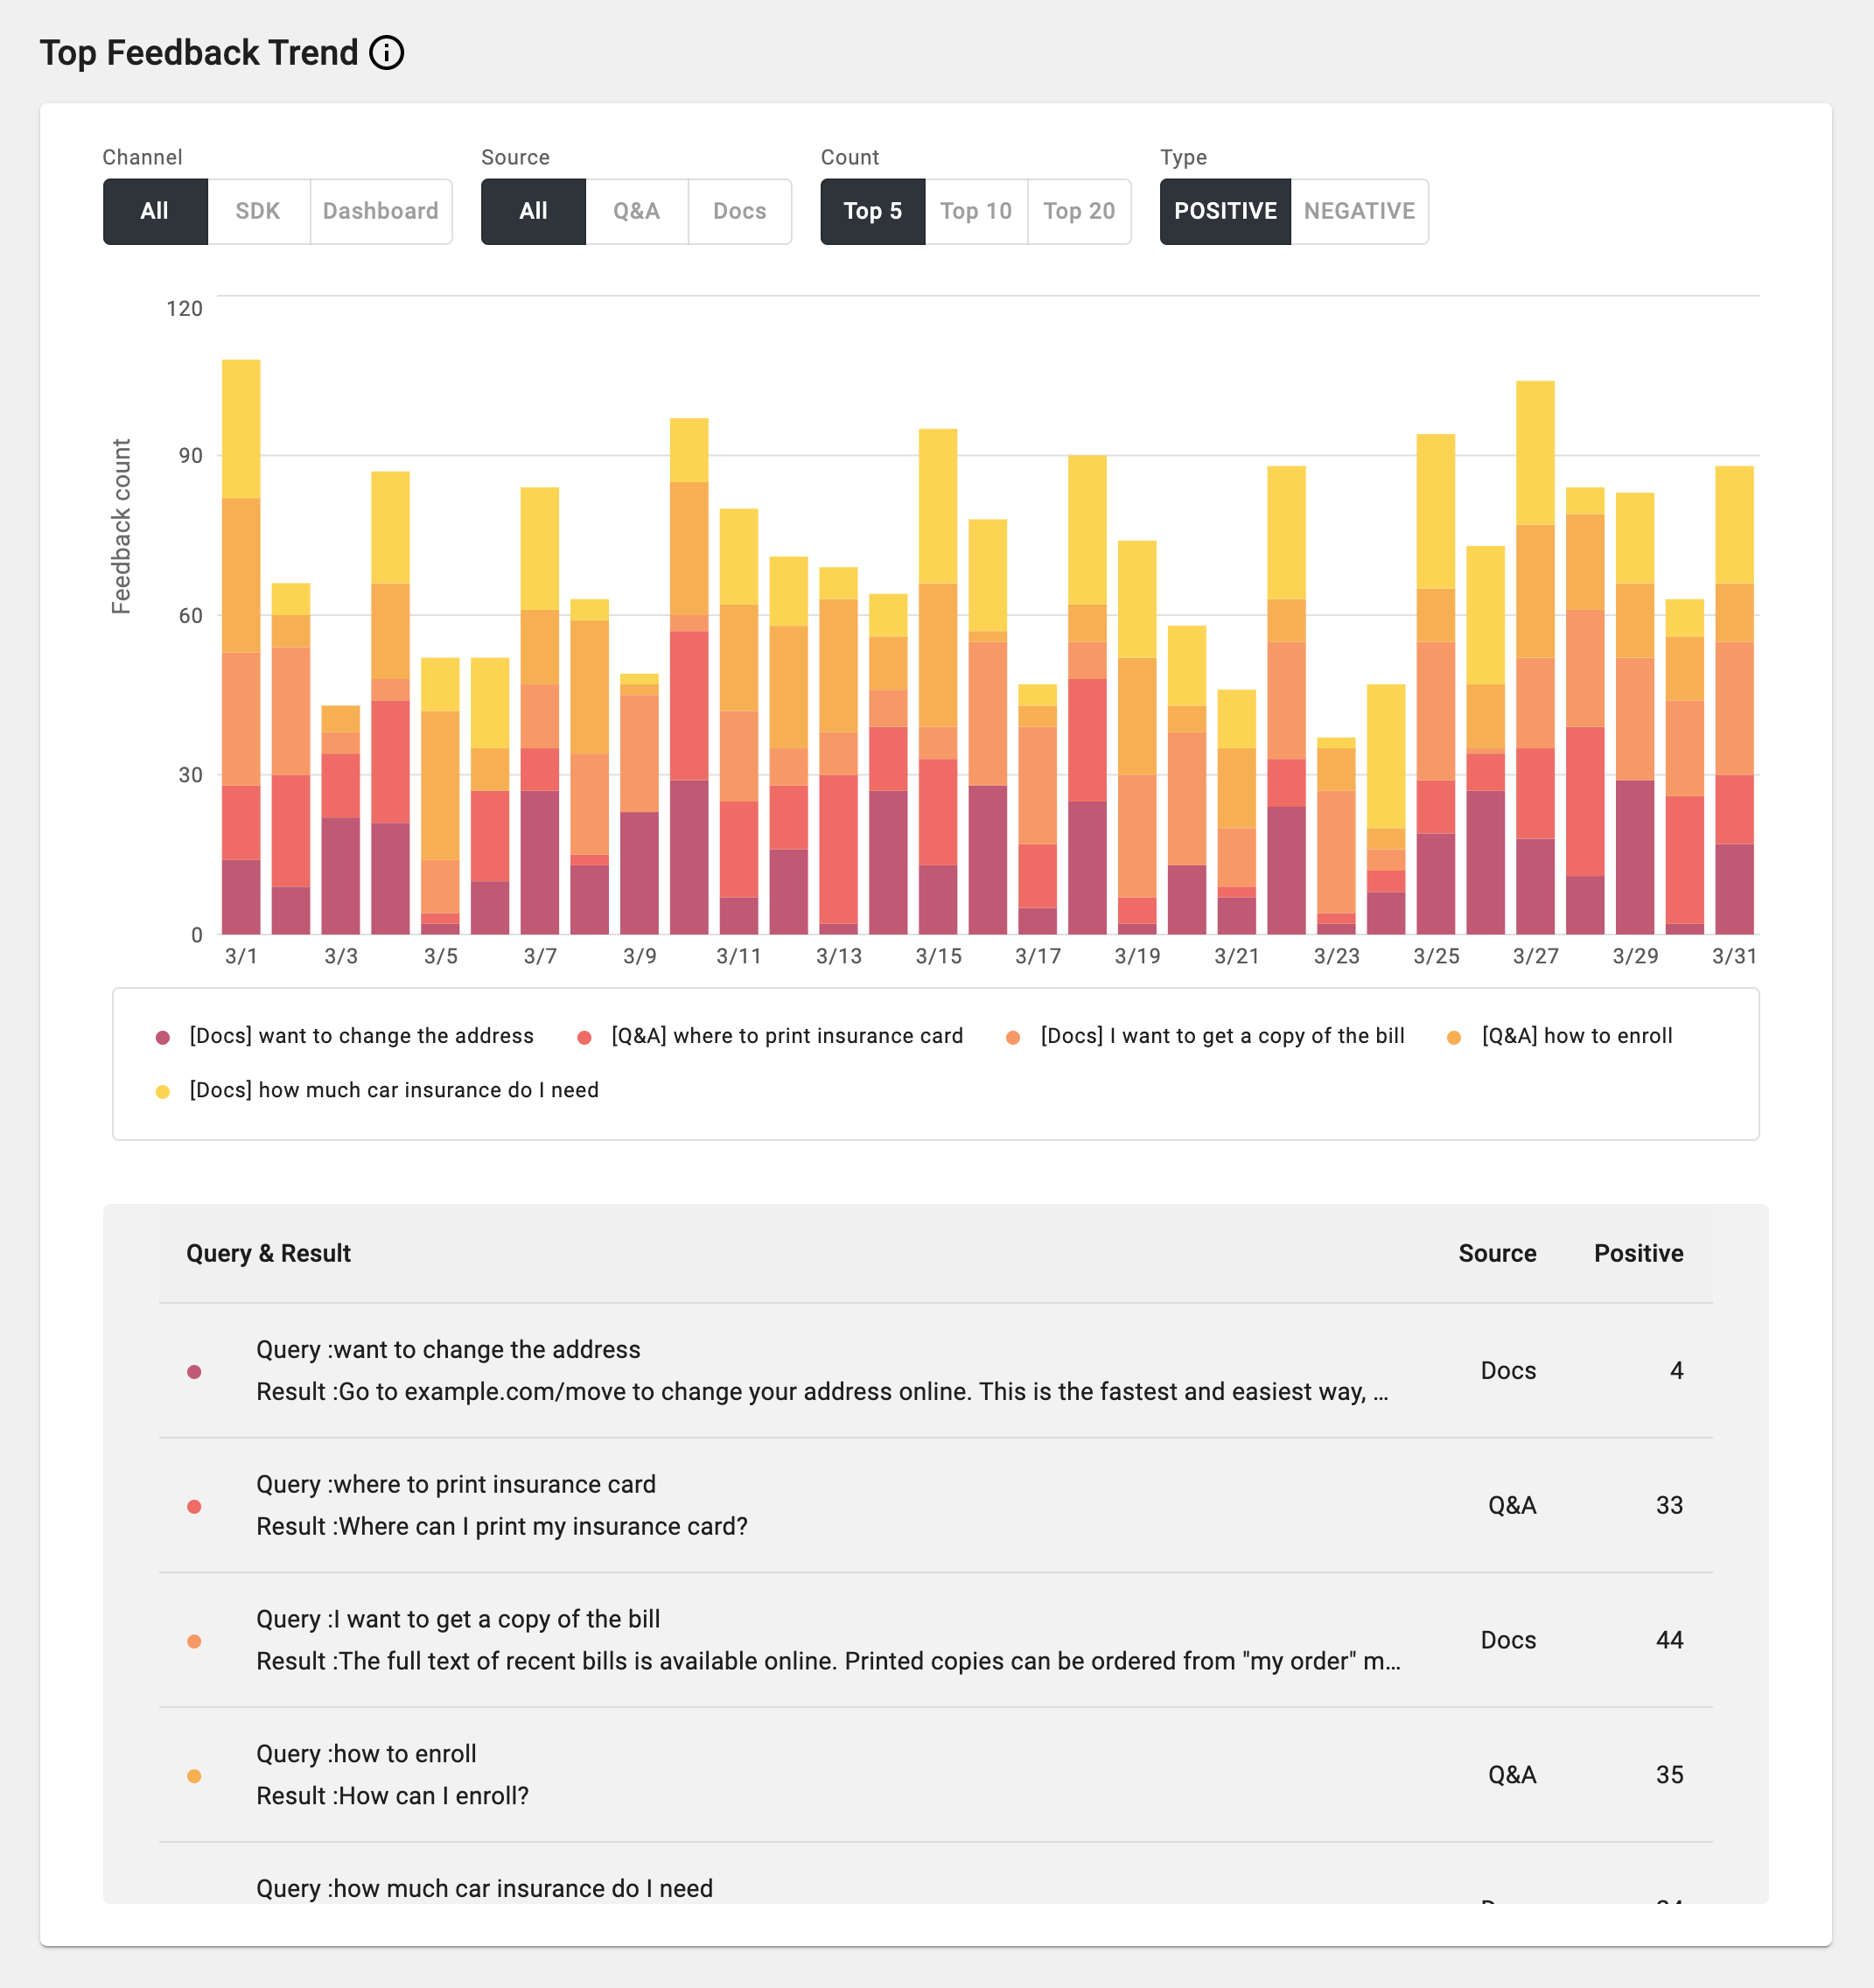
Top Feedback Trend: You can see the search query and result pairs that have the most number of feedbacks in selected date range, over the project's entire knowledge base including Q&As and Documents. The result can be filtered by channel, source, and the type of the feedback (positive or negative). The same queries are shown in the table below the graph and can be sorted by source and how number of positive feedback.
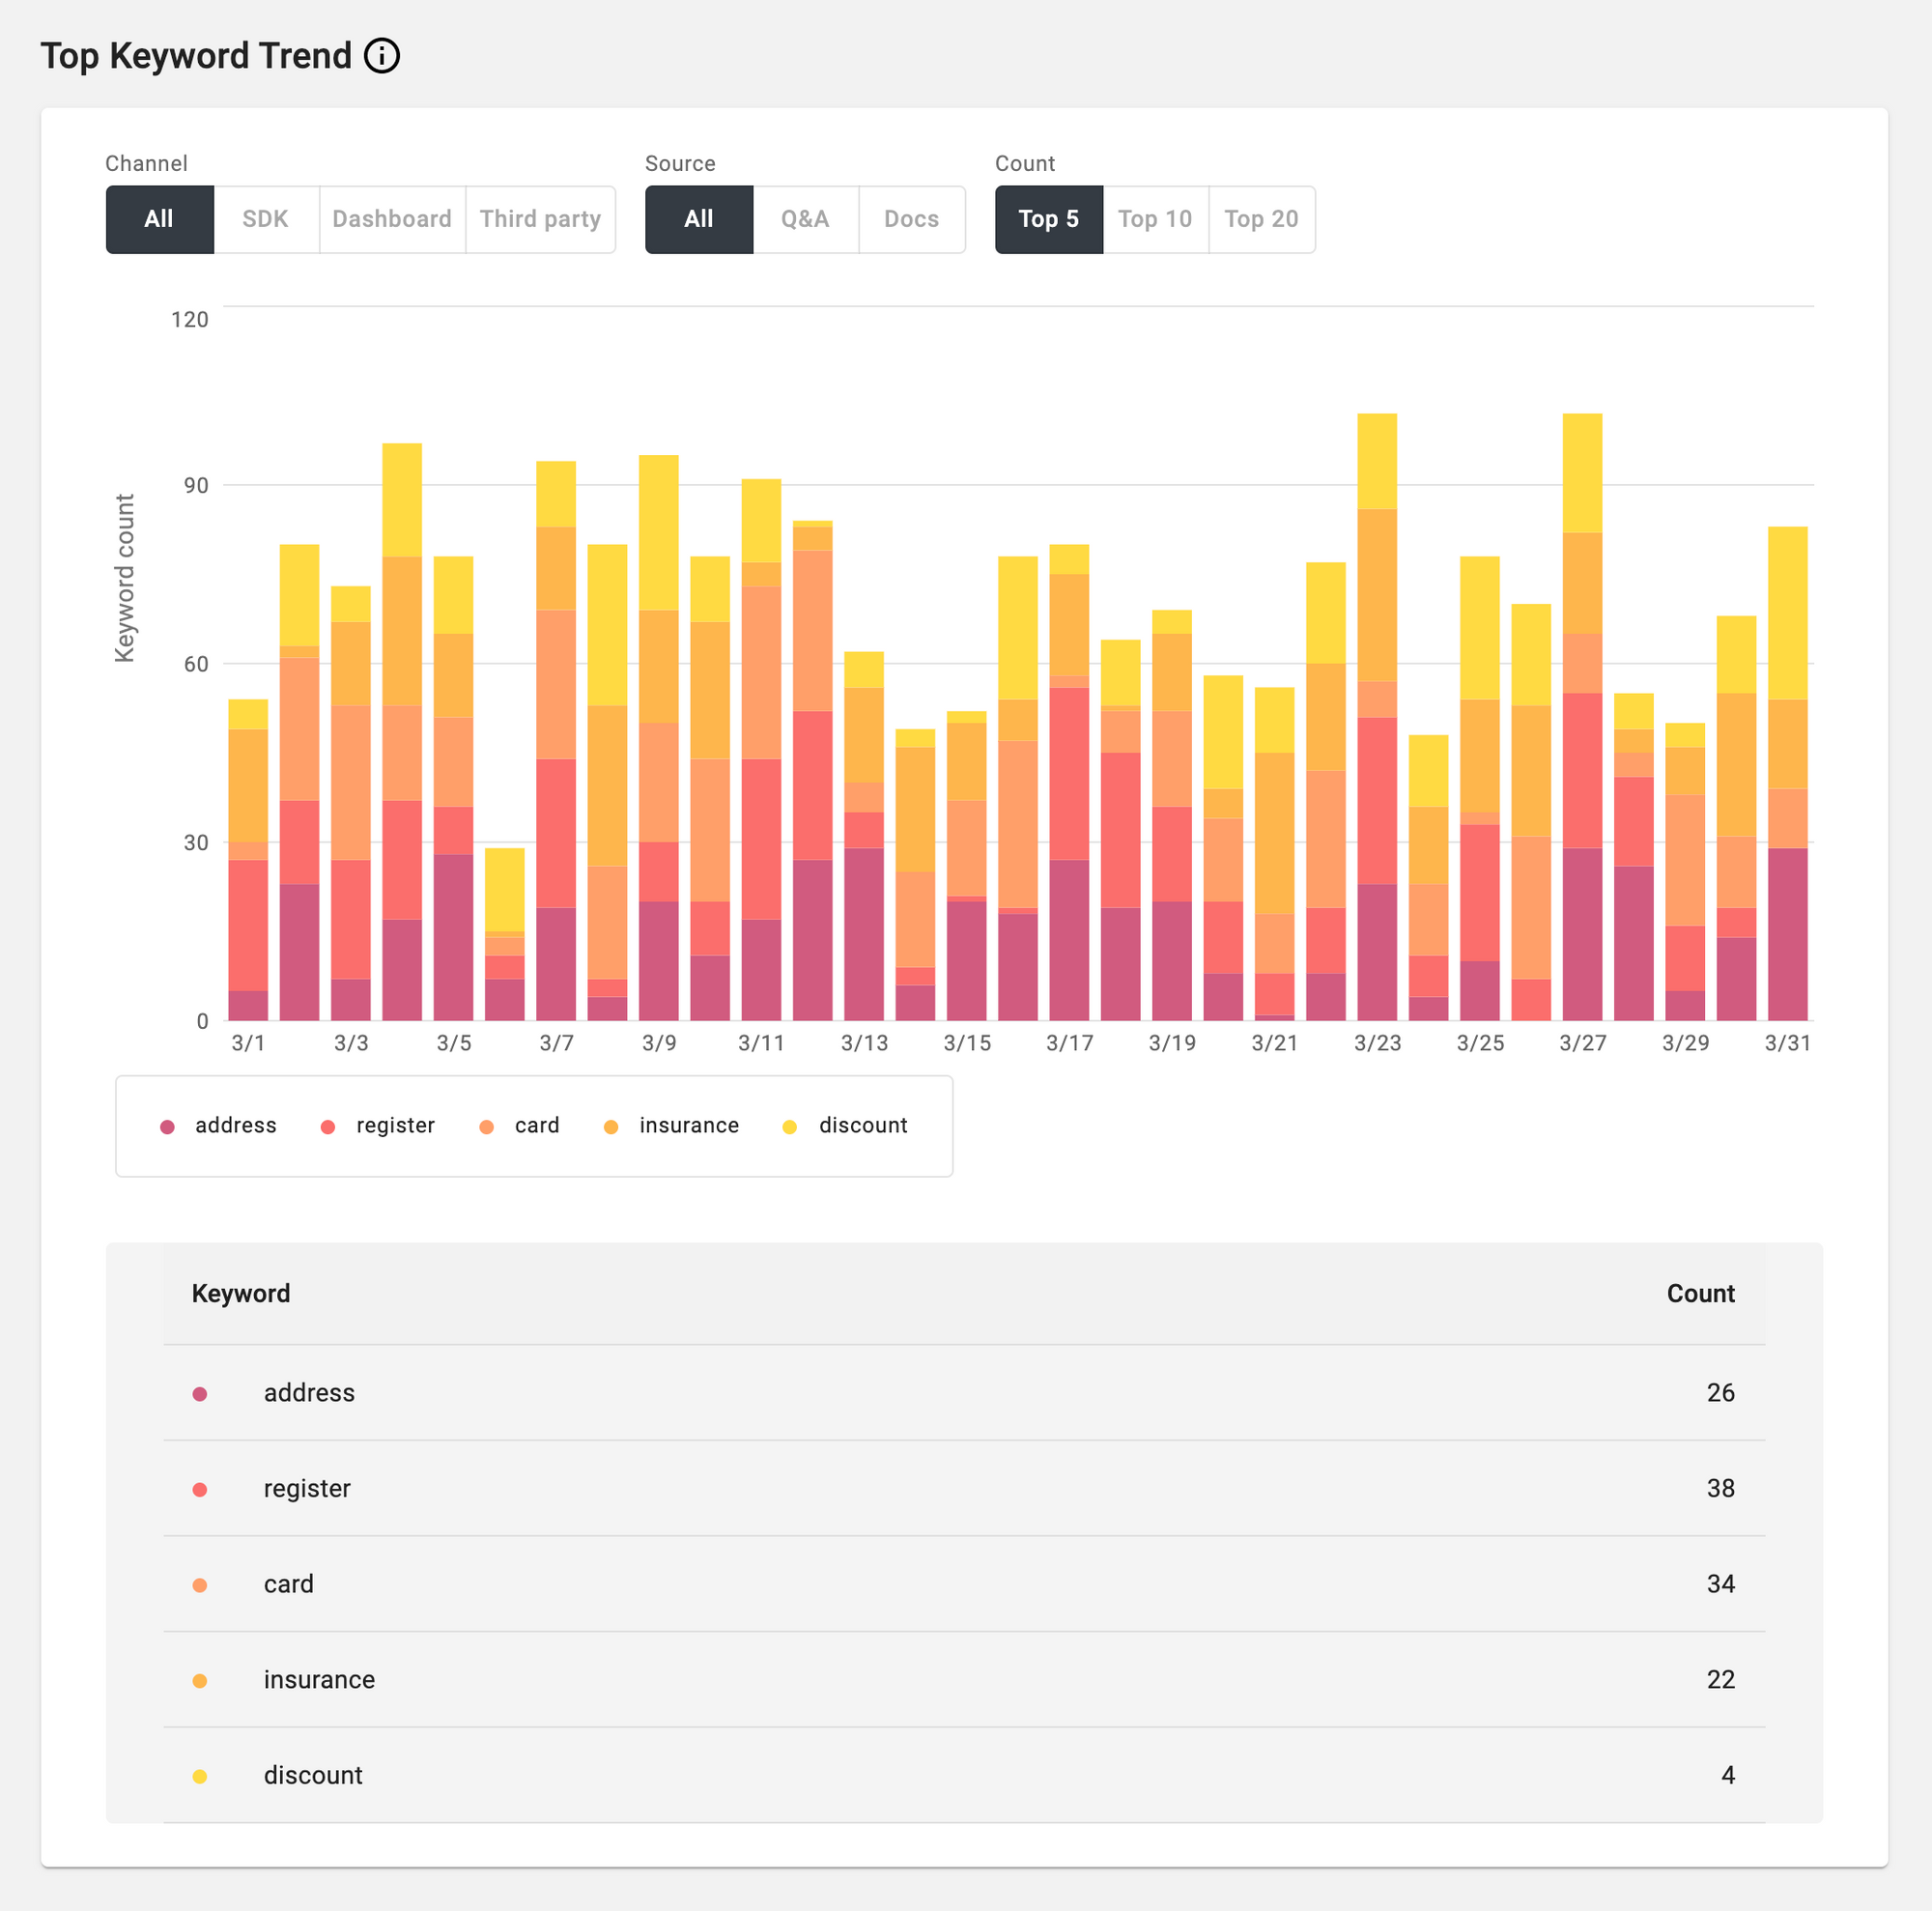
Top Keyword Trend: You can see most popular keywords that are included in any search queries to the project's knowledge base in selected date range. Alli extracts the keyword automatically from search queries to create this chart. These key words are shown in the table below the graph and can be sorted by number of occurrence.
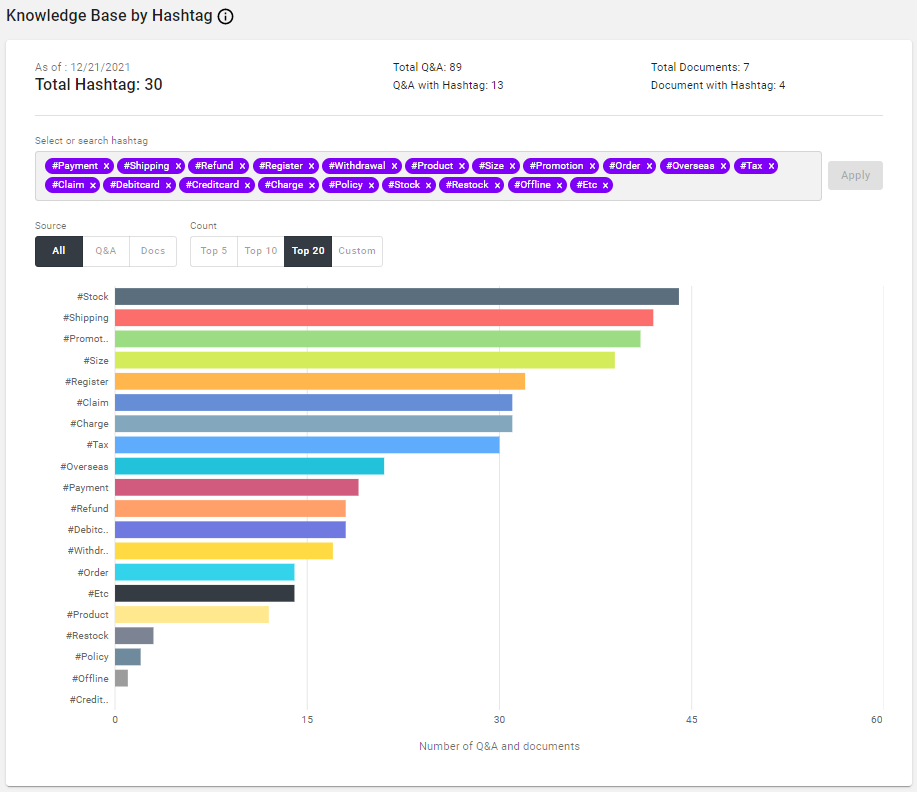
Knowledge Base by Hashtag: See all of your knowledge base broken down by up to 20 of your top hashtags.
If you have any suggestions or feedback, please don't hesitate to let us know so we can continue improving our Analytics feature. We'll work with you to find a way to meet your needs!
Updates
12/15/2021 - Added hashtag filter to see analytics for a specific tag. Only relevant data and graphs will show when filtered by hashtag. Only one hashtag can be selected at a time.
10/19/2021 - You can now sort most tables by most columns. You can also change the sorting order (ascending/descending).
8/24/2021 - Improved navigation menu
4/1/2021 - Top Documents trend chart, Top Feedback trend chart, Top Keyword trend chart are added.
12/23/2020
- Summary UI has been updated. Now you can select a channel (SDK, Dashboard, Third party) to see the analytics only from the selected channel.
- Query-related summaries now show numbers by source (Q&As or Documents).
Please see updated user guide below for more details.
11/4/2020
- Unique Participants, Unique Users who Asked Questions, and Unique Visitors are added in the Summary.
- Query Trend graph is added.
- You can apply Channels (All, SDK, Dashboard, Third-party) and Source (All, Q&A, Documents) filter for the graphs. Available filters are different by the type of the graph.
- Titles of some analytics are changed slightly.
6/4/2020
- 'Export data' button has been added. You can export up to 6 months of analytics data using this.
- 'Show demo data' toggle button has been added. If you turn this on, all the analytics data will be shown as virtual data for demo purposes.
Learn More About Allganize's Technology